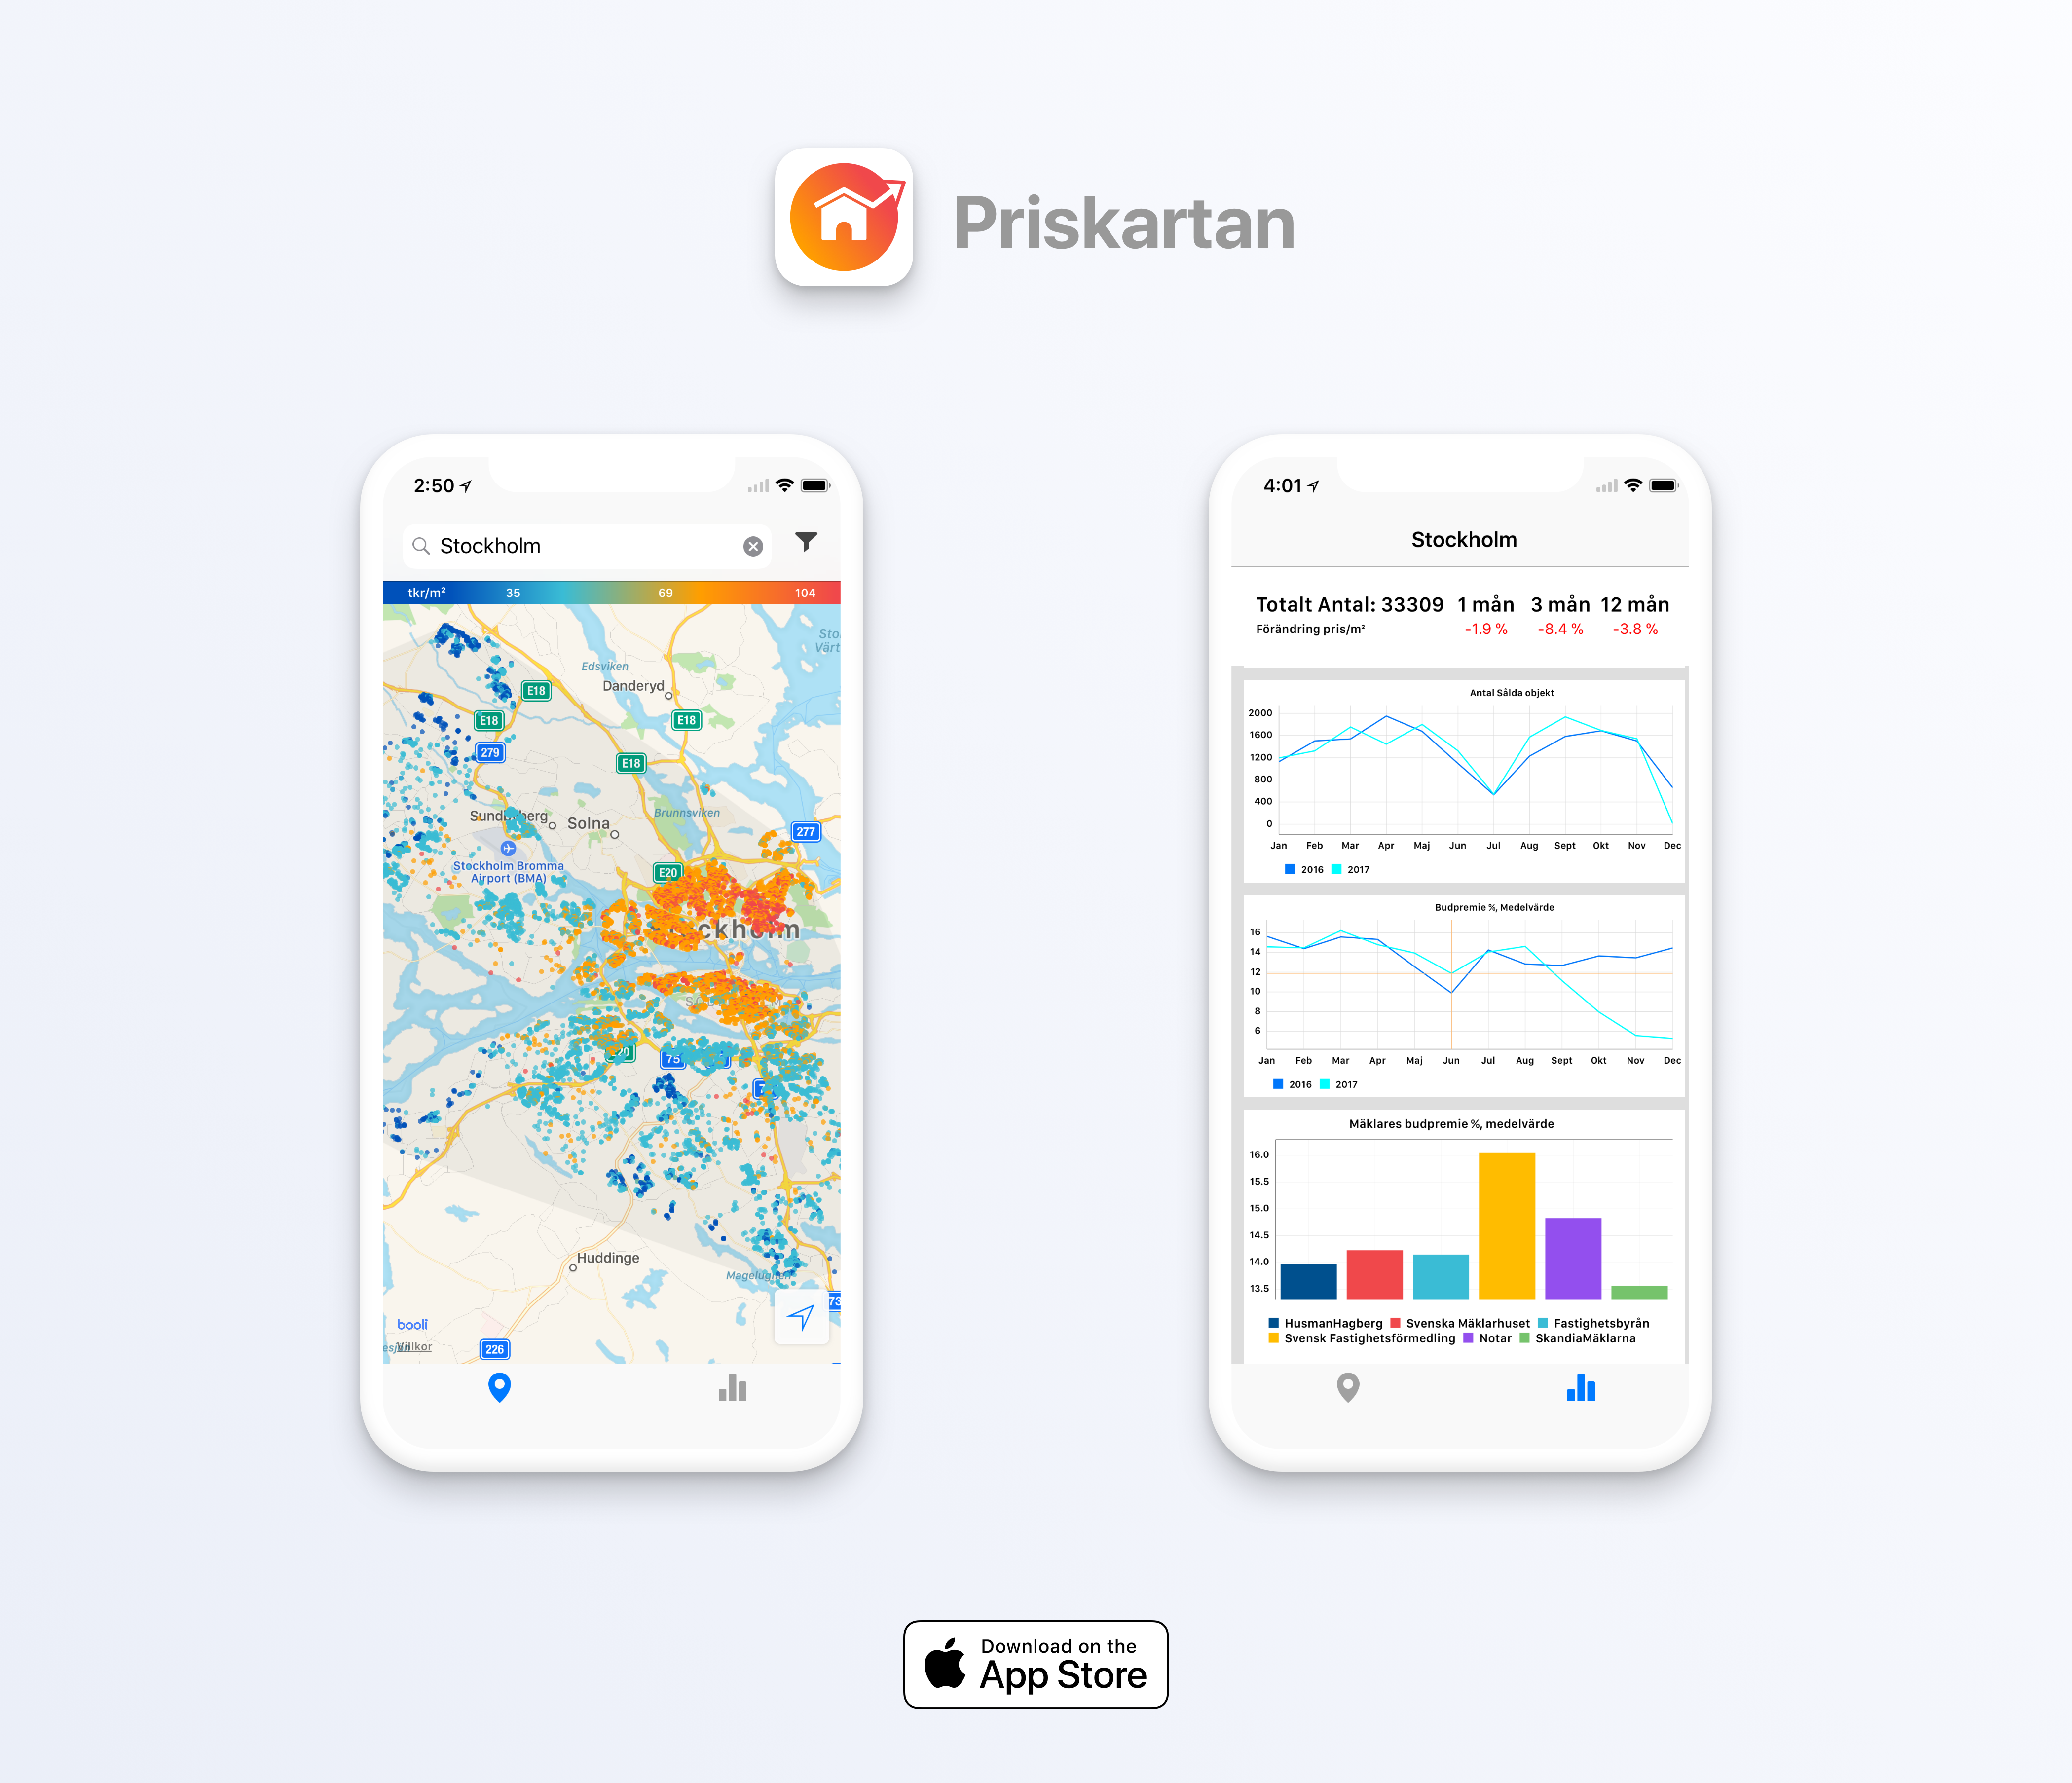
Intro
Get an overview and see trends about estate prices with always up-to-date info. See the price development during the last 2 years, as well as info about estate agents for a specific city or area.
My role
Idea, vision, programming in Swift (API-request, graphs, Map and annotations, UI)
Project
Team project together with Ola Göransson and Max Modesto Wallin
The inspiration to Priskartan came from the increasingly soaring prices on the Swedish property market. I found Booli’s open API, I decided I wanted to visualise the prices in the form of a heatmap. When realising the width of the project, classmates Ola Göransson and Max Modesto Wallin joined the effort.
After parsing the json data, our biggest obstacle became the limitations of the API, limiting each request to 500 objects each. The result was that downloading a larger city ended up taking a minute. Studying more about Swift’s Grand Central Dispatch, we managed to make a request to see how many objects were found in the search and then initialise the right amount of concurrent threads to optimise the download. Working together using Git gave me knowledge about splitting up the storyboards, gitignore after having encountered all typical problems when collaborating with Git.
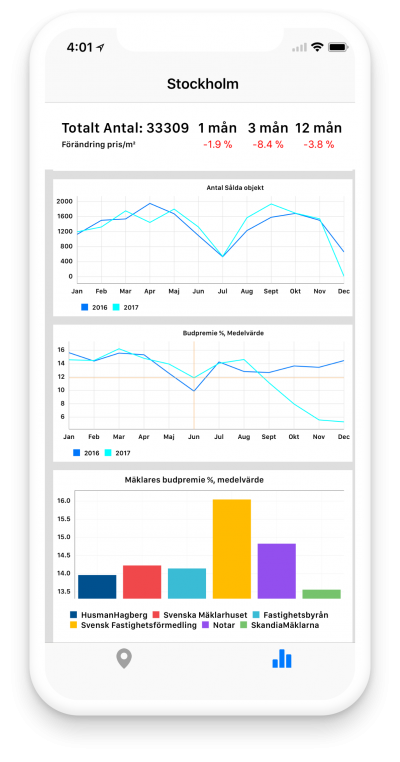
Graphs
In the graph-section we use an external library called Charts, that’s great to work with if it wasn’t for the inadequate documentation. The main challenge was converting the data to something interesting that the graphs could display. All the calculations are done on a background thread, and the UI is updated as soon as the calculations are done. While waiting a message and progress-indicator is shown to the user. The calculations gave me a great chance to practice and become comfortable in using the swift filter/map/flatmap/reduce functions. The data is forwarded to the graph tab via notification center.
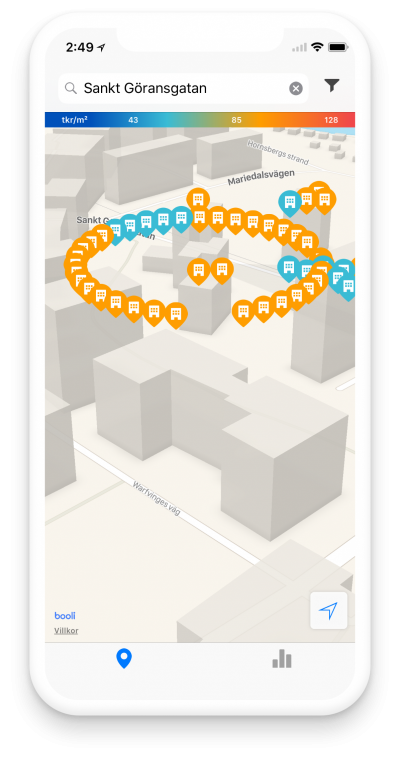
Overlapping annotations
Another interesting problem was how to display objects having the same coordinates. The default result is that the annotations overlap, making only one visible. The solution I ended up with was to filter through all annotations to see which ones are in the same spot. I then created new annotations in a circle around the original coordinate where the space in between is proportional to the number of annotations.